
Yes, folks – the rumors are true. HFS is officially out of the quadrant business.
We’re done, the whole quadrant craze is starting to smell pretty bad and we know the industry is fed up with it. Increasingly, many of these 2×2 matrices are missing several of the market leaders (who refuse to participate) and having them all stacked in the top right just smacks of pay-for-play (even if the analyst has fair intentions). Let’s be honest, noone trusts these matrices and they are harming the entire credibility of the analyst industry. Sure, there are many honest, quality analysts with integrity, but their craft is being soiled by several quacks who are basing their vendor placements purely on vendor briefings, whether they like a particular vendor, and whether some vendors pony up for their research services. There are many “analysts” out there who do not bother to do sufficient customer research and we all suspect who these characters (and their employers) are…
If we don’t change, we all – as analysts – might as well admit we’re no longer in the research business: we’re in the vendor PR business. Yes, it’s that bad… and let’s stop sugar coating it.
Enterprise executives tell us all the time they get zero value from these grids – they are purely for vendor marketing sales decks (and I talk to a helluva lot of these enterprise folks). However, enterprises desperately need to be informed on vendor performance – they just need a direct ranking that’s relevant for their needs, where a credible analyst puts a stake in the ground. That’s what everyone has told me, so that is what we are delivering: The HFS TOP 10.
Quadrants, Peaks, NEATS and Waves – and sadly Blueprints – are all sales tools for vendors as opposed to decision support tools for enterprise customers. At HFS, we are not in that business – we are in the research business to support informed enterprise decisions. At HFS, we are not ending our involvement in covering the hottest markets in the industry and producing the best competitive analyses, we are merely making our research more relevant, more timely and more impactful with the HFS TOP 10 and much more simplified to support the enterprise customer. What’s more, when some firms take six to nine months to get a quadrant to market, that market has often already moved on, and the data, despite its credibility, may already be stale. We are in a world that doesn’t stand still, where enterprise customers are thirsty for timely, credible data that clearly shows the winners, contenders and laggards in a given market.
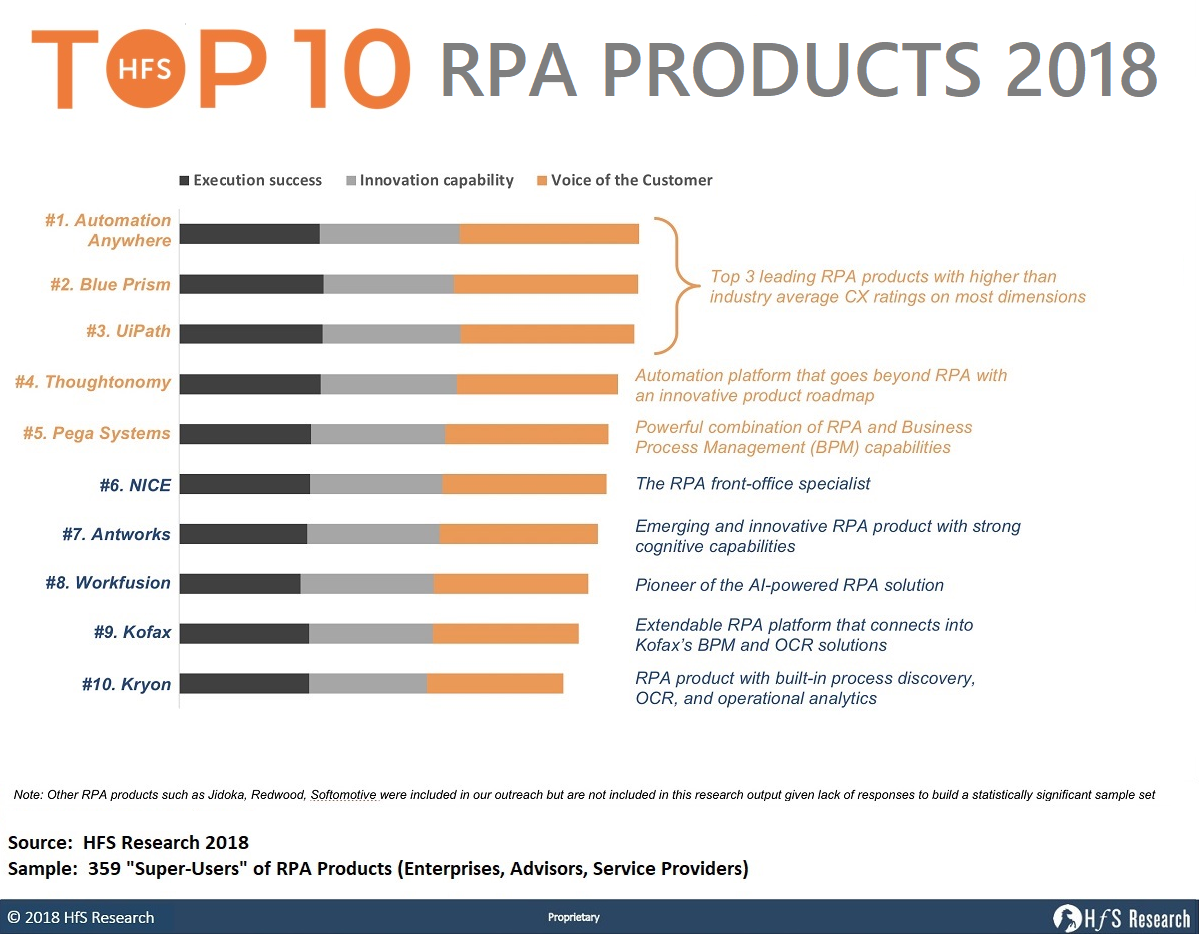
Customers want rankings where the analyst took a stand, not merely a fuzzy matrix where everyone looks like a winner. Here is an example of how the HFS TOP 10 ranking looks (the RPA Products in 2018), and here you can download a full report example to see for yourself how we get to the point, how we inform decisions and we clearly profile where vendors are strong – and where they face challenges.
HFS TOP 10 reports remove the unhealthy involvement of vendors from the analyst evaluation process and are much more timely, relevant and less cumbersome to produce
The main difference with the HFS TOP 10 is the fact we’re running them purely on desk research, support from our research academy and from our vast repository of current user data. We are eliminating the whole laborious vendor lobbying and briefing processes so we can get these reports out the door faster than ever before, without being tied to vendors schedules and relying on references they provide. This does not mean analysts cannot do vendor briefings to support their research (if the analyst deems it necessary, or if the vendor requests a timely briefing), it just means we do the research in a timeframe that can’t be moved. It means vendors cannot complain that we “did not do reference calls with their customers” or give them a chance to be adequately represented in the market. Because HFS already has the data! We have reams of data on service vendor performances, or vertical markets, on RPA products, on blockchain platforms, on analytics firms, on FinTechs etc. And where we may occasionally not have sufficient customer data in a niche market, we will invest in gathering it using the HFS network. Yes, we actually set aside funds for user surveys where most of our competitors only perform custom research when their customers are funding it.
Here are some FAQs you probably want answering:
1. How is the methodology of the HFS Top 10 different from the Blueprint? There are several key differences in methodology:
a. We are Ranking vendors, not Gridding them. The HFS Top 10 is presented as a simple and clear ranking of assessed products / service vendors versus the 2X2 Blueprint grid
b. Voice of the Customer, execution success, and innovation capability. The HFS TOP 10 methodology is driven by customer experience with products / services (voice of the customer) in addition to vendor’s ability to execute and innovate.
c. Powered by HFS G2000 network. The primary source of data for the HFS TOP 10 reports is HFS’ extensive network of G2000 enterprise customers. HFS will gather information via surveys, analyst interviews, and ongoing dialog with customers versus relying on data inputs from service vendors. HFS conducts over 5,000 interviews a year with enterprise customers right across the six change agent areas of our research coverage: RPA, AI, Smart Analytics, Global Sourcing, Blockchain and Digital Business Models.
d. Not reliant on vendor RFI responses. The Top HFS TOP 10 report methodology does not rely on the use of old-school traditional approaches of collecting data through vendor RFIs. We welcome vendors to augment our analysts’ knowledge base through structured briefings, demos, and reference customers, but this not a necessary component in the process. We will not allow vendors to slow-down our research processes.
e. No opt-out. There is no opt-out for leading vendors given HFS is relying 100% on its own network and data sets. We never produce vendor landscapes where half the leading players are absent.
2. Will there still be fact checks with the vendors?
Yes, vendor profiles, including strengths and development opportunities will be sent for fact-checks. However, rankings will not be shared in these fact-checks. An embargoed HFS TOP 10 will be released one-day prior to the actual release of the report, intended to be an FYI versus any negotiation on ranking etc. We are not in the lobbying business, we are in the research business.
3. What data will populate the HFS TOP 10 reports?
The data will be populated from multiple sources of information:
– The primary source of data for the HFS TOP 10 reports is HFS’ extensive network of G2000 enterprise customers. HFS gathers this information via surveys, analyst interviews, HFS roundtables and summits, and ongoing dialog with enterprise customers, versus relying on data inputs purely from service vendors.
– Providers can augment our analysts’ knowledge base through structured briefings, demos, and reference customers.
– Note that we will minimize the use of old-school traditional approaches of collecting data through vendor RFIs (unless covering a nascent / emerging market where most of the solutions are still in beta mode).
4. What is the minimum customer data-set needed to be able to guarantee a voice of the customer? What happens, if for whatever reason, there is not enough customer data?
A statistically significant sample set is 30 datapoints for a report across reference checks, our existing data sources, and our own customer conversations. While most of our current research has a significantly higher sample set than 30 there is rarely a lack of available data to use to source the rankings. Where a lack of customer data does occur, it may result in delays of the research publication as we make extra efforts to source customer data.
5. What can vendors do to maximize customer data access?
Real value usually comes through engaging with HFS analysts throughout the year by providing HFS analysts the opportunity to speak with more of their customers, sharing and collaborating on customer stories. As mentioned, we make it our business to do our own customer research – that is our purpose in the industry, but those vendors who can persuade many of their customers to showcase their experiences will benefit.
Posted in : OneOffice


This is pretty cool stuff. Are you also planning a HfS Top 10 for IT Service Providers?
Phil – That is awesome… much needed. Will you also stop selling ssponsorships at your events? That is probably the last "traditiomal" thing HfS does.
Hi Pat – the cost of staging these awesome events is very high. A typical New York summit is $250K a pop (as an example), so we wouldn’t be in business if we laid this all on for free. Just so you know we do not look to make a profit on these, merely break even (or come close) to keep the great conversation going. Now we could look to register ourselves as a "non-profit" organization. However, I know one that already does that and is anything but about profit =)
End of the day, we find most our clients want to be part of the journey and are happy to invest with us to create the narrative for where we are all heading…
PF
About time Phil…may the other research houses follow suit.
Great Phil, frankly the quadrants never made sense in many areas within Digital …
I stopped following the research community due to quid pro quo rankings, questionable conclusions, wild card estimates with no facts to back it up. Never understood the quadrants, PEAKS reasoning and i am surprised it has taken this long for someone to come up with Top 5 or Top 10 rankings, easy to understand, follow and to make sense. A vendor is number one only if their product or service is very good in terms of ease of use, extensibility, execution abilities, customer satisfaction, wide variety of integrations, no fluff and practical only.
HFS is sure disrupting the research industry !
Pretty cool .. the archaic model of research needs a huge refurbishing ..
Timing is perfect Phil Fersht, it’s about time market/vendor research is objective and market driven. Two questions 1. What’s the frequency of these rankings (I would imagine if the data is available consistently this could be turned into an automated ranking system)? 2. How will you make money (the reason most of the so called research outfits turned to Vendor PR agencies is to find money to run the business!) to sustain quality?
@Prasant: All good questions:
1) Frequency of TOP 10 Reports: We will be covering all the key industries and change agents (Blockchain, AI, RPA, Analytics, Global Sourcing and BPM, Digital business models) as we already have done, but with more speed due to the less cumbersome process and greater access to data and resources. We will be looking at 2/3 per month of these reports (Saurabh, our research head may kill me… but that is our aspiration)
2) Revenue model: Firstly, our revenue model was never dependent on license sales of quadrants (like other analyst firms). Our goal is to produce reports that are of great value to enterprise customers, tech vendors, service providers, consultants and investors. The greater the quality and depth or research, combined with access to our analysts, the more we can sell subscription access to the HFS research team and our roundtables and summits.
What’s more, as the industry evolves towards automation, AI, blockchain and digital, the legacy quadrant model is ridiculous. For example, talk to any buyer of RPA and they will tell you the recent matrices offer them no value or depth whatsoever. Is basically saying “this analyst populated some dots around a grid, so take their word for it”. It’s just time for a change,
PF
This is a real differentiator, Phil. I’ve always been puzzled how it seemed to me – years ago, as an outsider before I began connecting with analysts more regularly – that the traditional quadrant should have had a top left to bottom right slope – that is, one might sort of expect that highly creative and strategic companies might lack scale (bottom right), or that with scale comes a commitment to legacy and revenue that may be antithetical to taking big bets (top left). But most quadrants most of the time have a line marching from bottom left (weaker on both scale and vision) to top right (good on both). Perhaps this is the obvious answer that investments fuel innovation at scale, and investments come from good performance. But it just seems to me, guessing, that we’d have seen more ski-jump curve shapes starting top left..
As a side point, because I like to quantify my guesswork, I wonder if anyone has done a metananalysis on, say, the last decade of analyst 2-D rankings and seen if there is more or less clustering in certain industries or technologies or periods of time. I’ll leave that to a grad student to take the bait somewhere.
While industry is aware that the research reports are becoming a PR and any ranking is driven by how much the client is paying them, its time for someone who went to the basics of research and yes, this could be a huge differentiating factor and advantage for HfS for serious buyers who are looking at real research/insights.
Companies like Apple, Berkshire tells us that when you stick to basics and set your company to the benefit of your customers, people reward for that performance. I am sure, with this differentiated approach you are belling the cat which has strayed far from its path !
Hi Phil,
I am very much in support of the HFS approach. As you mentioned the new world of AI, Blockchain and others do not fit into the traditional wave and quadrant models, primarily as revenue and reference accounts are harder to come by.
I would be interested to know how you will research/rank the nascent markets where deployments are longer in the implementation cycle; ‘real’ disruptive technology takes longer to accept due to challenging existing processes; how you will deal with new collaboration approaches in areas such a DX where interoperability takes time to come to fruition, but enterprises need this visibility for their planning activities.
P.s. look forward to engaging with HFS
About time Phil Fersht. Hope we see it for other segments.
Paying analysts to score you relative to competitors is ridiculous. If I am running sales and marketing for a challenger tech brand I am not going to accept being publicly compared to competitors where I am less than number one. Why volunteer for a third-party opinion that places you behind your competitors? Bonkers.
if the analyst has access to your customers, they can score you regardless of whether you “opt-in” or do not. If you are an established player with a significant customer base and said analyst is not engaged enough with the industry to access them, then I question what that analyst firm is doing employing that analyst in the first place, and whether the analyst firm is training its analysts effectively / helping them survey their markets and get what they need to have informed opinions to support the scoring.
For small vendors who cannot pony up customer references they need to work harder to persuade customers to share their candid insights with analysts, otherwise they risk failing to establish themselves. If you know the analyst firm has little impact, then by all means avoid them – you are wasting your time on the lower tier analysts. However, you do need to convince the Gartners, Forresters (and I hope the HFSes) that you exist – and matter – otherwise, life is going to be hard getting projects to call you up. That is reality… and that is the job of marketing IMO: get your customers to sell you and create visibility and it’s very hard to rely on glitzy PPT and lovely booths at conferences alone!
PF
Lead on Phil Fersht !!! Its been terribly boring/tiring to peruse through the usual Regurgitated BS being circulated these days as Research/News. No more nodding heads 😉 LoL. Godspeed !!!
Making vendor ratings more objective by gathering the data from all vendors in the same way (in this case by going to the end user) certainly makes sense and ensures a level playing field. This way it will be much harder for skilled manipulators on the vendor side to influence the results. The only issue I have with this is how to ensure focused (e.g. in a vertical) vendors or new market entrants will be properly represented. This format is great for the mainstream and to rank the largest vendors but I’m still waiting for something more interactive that will allow easy customization of the rating criteria to accommodate different requirements. Apart from this it’s a great way to make research more accessible again.
Hi Sven – agree this methodology is solid for vendors where analysts have access to a statistically significant pool of customers, which is why we call it “The TOP TEN”. Where a vendor has a very small tiny customer base, it needs to be very proactive in persuading their inception clients to share their experiences. At HFS, we do not give the top ten players an opt-out option, otherwise the market view is not accurate. Analyst firms which allow exclusion of leading players are doing the industry a disservice and cannot claim to support buying decisions. These firms need analysts who have customer data and knowledge to include them. For small vendors who cannot pony up customer references (and there are many) they need to work harder to persuade customers to share their candid insights with analysts, otherwise they risk failing to establish themselves. Many analysts rarely talk to customers and literally score vendors on how well they performed in a briefing and the gloss of their PPT (oh yes).
My advice to start-up / emerging vendors is to steer clear of these reports until they can support their offerings with client cases. We publish “Hot Vendors” for example, where we highlight emerging firms. PF
Good news. I believe the Top 10 will allow us to have more regular and meaningful interactions with your team throughout the year. It will put less pressure on our clients as they will have more lead time to talk to the analysts. Finally, the ability to update HfS through timely structured briefings, demos, and reference customers as the opportunities arise throughout the year, is a much more targeted and strategic approach. Look forward to interacting with HfS in a more strategic way going forward.
Phil,
This is timely and welcome change. I have a suggestion on the ranking – in addition to voice of the customer, execution success, and innovation capability, you may want to include the quantified business benefits ( either $ terms or improvement in business metrics) as realized by the customers as one of the additional factors. It is my experience that business value realization varies significantly across the spectrum depending on ease of configuration, SI ecosystem, skills availability etc.
Good luck with making the rankings as industry standard…
I would never do a ‘quadrant’ analysis (which got me in serious trouble at Ovum). Fortunately for me, Financial Insights (IDC) were just gearing up to do them when I left IDC in the beginning of 2009. However, I continue to believe that an analyst generates more value by creating 3-5 year future thought leadership discussing how technology could impact an industry (insurance in my case) rather than discussing what vendors are doing ‘today.’
Barry
Do you make recommendations based on use cases, rather than Gartner’s old two dimensional quadrants?
@Ludovic – Yes, this is three-dimensional. The HFS TOP 10 methodology is driven by customer experience with products / services (“voice of the customer”) in addition to vendor’s ability to execute and innovate.
HFS conducts over 5,000 interviews a year with enterprise customers right across the six change agent areas of our research coverage: RPA, AI, Smart Analytics, Global Sourcing, Blockchain and Digital Business Models. Hence we are not reliant on vendor RFI responses. We welcome vendors to augment our analysts’ knowledge base through structured briefings, demos, and reference customers, but this not a necessary component in the process. We will not allow vendors to slow-down our research processes.
PF
Phil – Reviewed the sample report and found it easy to digest. Especially appreciated the transparency around how the ratings were derived. Will watch this space with interest…
One question: as you move into areas with more product / service providers, and assuming you stick with a “Top 10” motif, what visibility will you provide as to who did NOT make the Top 10 list? There’s a difference between not having enough sample size and not being good enough to crack the Top 10, for example.
Bravo! One of the most nonsensical aspects of traditional analyst evaluations is that they have such a rear view perspective. We are currently in the process of responding to three MQs and the evaluation is based on 2017 data – while we’ll certainly put forward 2018 developments the evaluation is based on old data and by the time it’s published (January of 2019) the data will be one to two years old! Don’t Sourcing and Procurement managers understand that basing shortlisting decisions on these reports is risky? How will HfS engage this community to communicate these changes and demonstrate that the Top 10 process is actually more representative of the current market?
Dear Phil and Team at HFS. This move is the right thing to do and its overdue. It will take a while to get this widely accepted but it is very much worth the try. Wish you success with this initiative.
Phil, not that I like quadrants (magic or not) much but… I think you’re saying HfS still does vendor evaluations -just unidimensional vs XY plots, don’t do vendor surveys but still takes briefings, still runs fact checks and still takes vendor money?
I’ll add that IMHO for hardware and software, briefings and roadmaps and maybe surveys are essential to an evaluation. For services, I can see there’s a case for getting rid of that those questionnaires as they’re getting meaningless. So full marks to you on this one.
The scale at which you’re blending in clients interviews is on the other side very interesting, though not as scalable as the way Gartner brings in Peer Insights into their MQ.
Or did I miss anything?
PS: I know nothing about RPA but there are interesting differences between your list and that of Gartner > https://siliconangle.com/2019/07/11/gartner-reveals-first-magic-quadrant-robotic-process-automation/